Hi,
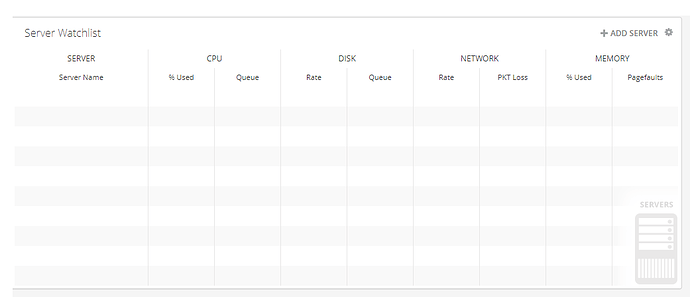
Is there any way to create a table, cards, rows, or columns similar to the example on the picture I have attached? I am not sure what you call it exactly but I want to have 2 rows with repetitive stripe background colors like light gray and white. Kind of similar to what is seen in Microsoft Excel. I am building a VM monitoring dashboard and this feature would be a great plus to the dashboard.
Hey Duckie, right now there really is NOT a good way to do this. The Griddle controls that are being used for this don’t support it without a lot of work on the backend to customize griddle and then exposing this as a new-udgrid option…
The better and faster way for use to implement this right now is to continue to build on the work @AlonGvili has been doing to add support for Material UI controls such as some of the things seen here: https://material-ui.com/demos/tables/
We have this filed on the GitHub issues backlog so feel free to +1 - but this question has come up a few times and we think the move to Material UI is really going to give everyone a lot of new options for styling/look&feel.
Tables are going to be alot of work , but its going to be fun
There is a way to do the colors, but it breaks sorting, which is probably more important for your scenario.
Thanks,
Tim Curwick
Hi Everyone,
Sorry for the late reply. I was on vacation and is finally back working on the Dashboard again.
The material-ui.com link leeberg included has quite a bit of table stuff I can use. Thank you all for your support and feedback.
we starting to work on tables but i trying to implement react-virtualized for fast rendering of large data it will take some time
Wonder the feasibility of mixing and matching with other solutions out there like PSWriteHTML which uses datatables.net.
Looking at integrating React Data Grid into UD: http://adazzle.github.io/react-data-grid/
Gonna be streaming tonight on how to do that tonight: https://www.twitch.tv/events/VwVpfqugSXSODb9dOUjLXA
I have only just started looking at Universal Dashboards and really excited to be using it. While thinking of dashboards I could do and looking at what components are available the first suggestion that came to mind was a table/grid that could do more advanced things like grouping and even tree view. So if React Data Grid is going to integrated that would useful.
