I am using get-counter to query a set of print servers for jobs spooling and jobs printing. These print servers are busy and will sometimes throw an error. After the error, I have to refresh the page and sometimes iisreset my dashboard server to get it to display correctly.
Is there a way to handle this automatically?
set those variables in the endpoint, and schedule the endpoint to refresh every x amount of seconds
what would that look like? here is my code:
    New-UDColumn -SmallSize 4 -Content {
        New-UDMonitor -Title "Current Print Jobs Printing" -Type Line -Endpoint {
            ((get-counter "Print Queue(_total)\Jobs" -ComputerName print101,print102,print103,print104,print105,print106 -ErrorAction SilentlyContinue).countersamples.cookedvalue | Measure-Object -Sum).sum | Out-UDMonitorData
        } -DataPointHistory 20 -RefreshInterval 30 -Options @{  legend = @{  display = $false } }

    }
So at the top of my dashboards I define a schedule and an Endpoint, so this will for example make sure all grids that im using my CACHED variables to populate will be getting this data every 5 seconds:-
$Schedule = New-UDEndpointSchedule -Every 5 -Second
$Endpoint1 = New-UDEndpoint -Schedule $Schedule -Endpoint {
###Put functions and code in here define the variables with $Cache:varname format
}
So where your calling the “Get-Counter” I would stick that into a cache variable and call the cached variable instead…hope that makes sense?
yes, i will give it a whirl
thank you so much
No worries hopefully I have given you some useful information more can be found here:-
https://docs.universaldashboard.io/endpoints/endpoint-initialization
I use endpoints on all my dashboards 
I am obviously missing something here. I can get the cache variable to work perfectly on a new-udcounter, but not on the new-udmonitor. I can successfully query the cache variable directly and pipe it to out-udmontiordata but it will not render on my dashboard.
PS::D:_|05.23|10:53:53> $cache:printqueue | Out-UDMonitorData
{
“y”: 28,
“x”: “/Date(1558626837421)/”
}
here is the code:
        New-UDCounter -Endpoint {$cache:printqueue} -RefreshInterval 5 -AutoRefresh
        New-UDMonitor -Endpoint {$cache:printqueue | Out-UDMonitorData} -RefreshInterval 5 -AutoRefresh -Title monitor
here is the result:
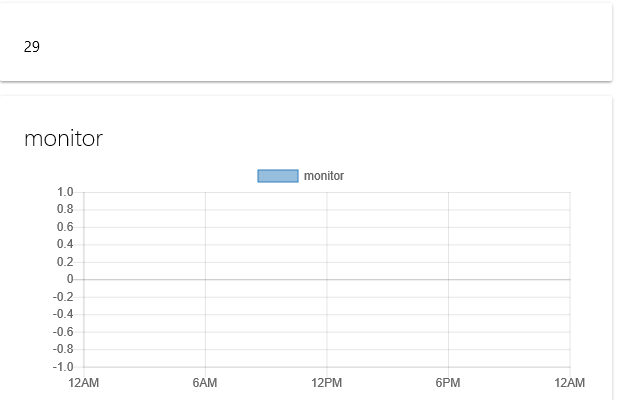
hey @jeffmckean it’s hometime for me now, but I am using a monitor to monitor files on the network…looking at my one I am only looking at the COUNT property of the thing im querying
New-UdMonitor -Title “FTP Imported Files” -Type Line -DataPointHistory 20 -RefreshInterval 5 -ChartBackgroundColor ‘#80FF6B63’ -ChartBorderColor ‘#FFFF6B63’ -Width 2 -Endpoint {
(gci “\server\files\monitor”).count | Out-UDMonitorData
So on your $cache:printqueue change it to $cache:printqueue.count
got it…thanks for your help @psDevUK
awesome @jeffmckean some-things on universal dashboards have me stumped for hours thinking what am I doing wrong. I have always found if you cannot get an answer, then @adamdriscoll has always provided excellent customer service. He really does seem like a honest down-to-earth bloke who has created this awesomeness! I’m hooked on dashboards now if that’s not obvious enough, I find you can use them for so many things. Happy dashboarding @jeffmckean
