Debugging v3 Dashboards with Wait-Debugger

Is this still possible in v3?

I’m trying to get a v2 dashboard updated to work under the new version and having a bit of trouble parsing the JArray output of Get-UDElement for a UDSelect with -multiple set.

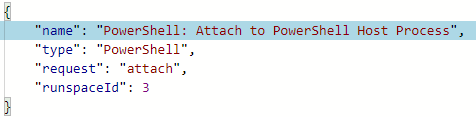
My route for things like this on the old version would be to add Wait-Debugger and then use Debug-Runspace to inspect my variables, but I don’t seem to be able to access the runspace via Attach to Host Process from VSCode or from the console offered from Powershell Universal.

I can see a Runspace at InBreakpoint from the PS Universal console, but Debug-Runspace returns nothing.

From VSCode if I try to attach to the host process listed in the Dashboards view it hangs and won’t let me interact. Seems like it’s connected though, as if I run a command from the PS Universal console, I get another “Command or script completed” message in my VSCode console.

image

Made some progress - not quite sure what I’m doing differently, but after restarting the service it’s connecting reliably.

Is there a way of actually running commands against the runspace this way?

(or alternatively - how do I access the values of a multi-select UDSelect? I’m getting a JArray object when accessing (Get-UDElement).value and for some reason can only get type data out of it, no actual values - I’m sure with 5 mins at a debug console bashing around I’d work out what I’m screwing up!) - in fact, I’ll create a new thread for that. I’m sure it’s something simple I’m messing up.

So I’d entirely missed the Enter-PSHostProcess which allows you to connect to the process via ISE and then you have a fully functional debug console.

Still haven’t managed to sort my UDselect problem, but the debugging is much more pleasant now :slight_smile: