Just opened a github issue for above
when testing Invoke-UDEvent for a scheduled EndPoint works but error shows on chrome dev tools when try to use onclick button again after refreshing the grid
Just opened a github issue for above
when testing Invoke-UDEvent for a scheduled EndPoint works but error shows on chrome dev tools when try to use onclick button again after refreshing the grid
Sounds weird, as that command is pure powershell without any javascript.
Any example code?
Get-UDDashboard | Stop-UDDashboard

$Schedule1 = New-UDEndpointSchedule -Every 1 -Day

$Services = New-UDEndpoint -Schedule $Schedule1 -Id "MyTest" -Endpoint {

```
$Cache:Services = (Get-Service -ComputerName "server1" -Name "*Certification*") | Select-Object Name, Status | Sort-Object Name | ForEach-Object {


    $FontColor = 'Green'

    if ($_.Status -ne 'Running') {

        $FontColor = 'Red'
    }


    [PSCustomObject]@{
        Name   = $_.Name
        Status = New-UDElement -Tag 'div' -Attributes @{ style = @{ color = $FontColor } } -Content { $_.Status.ToString() }
        Select = if ($_.Status -eq 'Stopped') {

            New-UDTooltip -Type info -Effect float -Place top -TooltipContent { "Start service!" } -Content {
                New-UDButton -BackgroundColor "Red" -Text "Start" -OnClick {
                    Get-Service -ComputerName "server1" -Name $_.Name | Start-Service
                    Invoke-UDEvent -Id MyTest -scheduled
                    Show-UDToast -Message "Service Started!" -MessageColor Green -Title $_.Name -Position topCenter -Duration 2500
                }
            }

        }
        else {

            if ($_.Status -eq 'Running') {

                New-UDTooltip -Type info -Effect float -Place top -TooltipContent { "Stop service!" } -Content {
                    New-UDButton -BackgroundColor "#26a69a" -Text "Stop" -Icon stop_circle -OnClick {
                        Get-Service -ComputerName "server1" -Name $_.Name | Stop-Service
                        Invoke-UDEvent -Id MyTest -scheduled
                        Show-UDToast -Message "Service Stopped!" -MessageColor Red -Title $_.Name -Position topCenter -Duration 2500

                    }
                }
            }
        }
    }
}
```

}

$HomePage = New-UDPage -Name "Home" -Icon home -Content {
New-UDCard -Title "Welcome"

```
New-UdRow {
    New-UdColumn -Size 6 -Content {
        New-UdRow {
            New-UdColumn -Size 12 -Content {
                New-UdTable -Title "Server Information" -Headers @(" ", " ") -Endpoint {
                    @{
                        'Computer Name'         = $env:COMPUTERNAME
                        'Operating System'      = (Get-CimInstance -ClassName Win32_OperatingSystem).Caption
                        'Total Disk Space (C:)' = (Get-CimInstance -ClassName Win32_LogicalDisk -Filter "DeviceID='C:'").Size / 1GB | ForEach-Object { "$([Math]::Round($_, 2)) GBs " }
                        'Free Disk Space (C:)'  = (Get-CimInstance -ClassName Win32_LogicalDisk -Filter "DeviceID='C:'").FreeSpace / 1GB | ForEach-Object { "$([Math]::Round($_, 2)) GBs " }
                    }.GetEnumerator() | Out-UDTableData -Property @("Name", "Value")
                }
            }
        }
        New-UdRow {
            New-UdColumn -Size 3 -Content {
                New-UdChart -Title "Memory by Process" -Type Doughnut -RefreshInterval 5 -Endpoint {
                    Get-Process | ForEach-Object { [PSCustomObject]@{ Name = $_.Name; WorkingSet = [Math]::Round($_.WorkingSet / 1MB, 2) } } | Out-UDChartData -DataProperty "WorkingSet" -LabelProperty Name
                } -Options @{
                    legend = @{
                        display = $false
                    }
                }
            }
            New-UdColumn -Size 3 -Content {
                New-UdChart -Title "CPU by Process" -Type Doughnut -RefreshInterval 5 -Endpoint {
                    Get-Process | ForEach-Object { [PSCustomObject]@{ Name = $_.Name; CPU = $_.CPU } } | Out-UDChartData -DataProperty "CPU" -LabelProperty Name
                } -Options @{
                    legend = @{
                        display = $false
                    }
                }
            }
            New-UdColumn -Size 3 -Content {
                New-UdChart -Title "Handle by Process" -Type Doughnut -RefreshInterval 5 -Endpoint {
                    Get-Process | Out-UDChartData -DataProperty "HandleCount" -LabelProperty Name
                } -Options @{
                    legend = @{
                        display = $false
                    }
                }
            }
            New-UdColumn -Size 3 -Content {
                New-UdChart -Title "Threads by Process" -Type Doughnut -RefreshInterval 5 -Endpoint {
                    Get-Process | ForEach-Object { [PSCustomObject]@{ Name = $_.Name; Threads = $_.Threads.Count } } | Out-UDChartData -DataProperty "Threads" -LabelProperty Name
                } -Options @{
                    legend = @{
                        display = $false
                    }
                }
            }
        }
        New-UdRow {
            New-UdColumn -Size 12 -Content {
                New-UdChart -Title "Disk Space by Drive" -Type Bar -AutoRefresh -Endpoint {
                    Get-CimInstance -ClassName Win32_LogicalDisk | ForEach-Object {
                        [PSCustomObject]@{ DeviceId = $_.DeviceID;
                            Size                    = [Math]::Round($_.Size / 1GB, 2);
                            FreeSpace               = [Math]::Round($_.FreeSpace / 1GB, 2);
                        } } | Out-UDChartData -LabelProperty "DeviceID" -Dataset @(
                        New-UdChartDataset -DataProperty "Size" -Label "Size" -BackgroundColor "#80962F23" -HoverBackgroundColor "#80962F23"
                        New-UdChartDataset -DataProperty "FreeSpace" -Label "Free Space" -BackgroundColor "#8014558C" -HoverBackgroundColor "#8014558C"
                    )
            } -Options @{
                scales = @{
                    yAxes = @(@{
                            min = 0
                        })
                }
            }
        }
    }
}
New-UdColumn -Size 6 -Content {
    New-UdRow {
        New-UdColumn -Size 6 -Content {
            New-UdMonitor -Title "CPU (% processor time)" -Type Line -DataPointHistory 20 -RefreshInterval 5 -ChartBackgroundColor '#80FF6B63' -ChartBorderColor '#FFFF6B63'  -Endpoint {
                try {
                    Get-Counter '\Processor(_Total)\% Processor Time' -ErrorAction SilentlyContinue | Select-Object -ExpandProperty CounterSamples | Select-Object -ExpandProperty CookedValue | Out-UDMonitorData
                }
                catch {
                    0 | Out-UDMonitorData
                }
            }
        }
        New-UdColumn -Size 6 -Content {
            New-UdMonitor -Title "SQL CPU (% processor time)" -Type Line -DataPointHistory 20 -RefreshInterval 5 -ChartBackgroundColor '#80FF6B63' -ChartBorderColor '#FFFF6B63'  -Endpoint {
                try {
                    Get-Counter '\Processor(_Total)\% Processor Time' -ComputerName sql -ErrorAction SilentlyContinue | Select-Object -ExpandProperty CounterSamples | Select-Object -ExpandProperty CookedValue | Out-UDMonitorData
                }
                catch {
                    0 | Out-UDMonitorData
                }
            }
        }
        New-UdColumn -Size 6 -Content {
            New-UdMonitor -Title "Memory (% in use)" -Type Line -DataPointHistory 20 -RefreshInterval 5 -ChartBackgroundColor '#8028E842' -ChartBorderColor '#FF28E842'  -Endpoint {
                try {
                    Get-Counter '\memory\% committed bytes in use' -ErrorAction SilentlyContinue | Select-Object -ExpandProperty CounterSamples | Select-Object -ExpandProperty CookedValue | Out-UDMonitorData
                }
                catch {
                    0 | Out-UDMonitorData
                }
            }
        }
        New-UdColumn -Size 6 -Content {
            New-UdMonitor -Title "SQL Memory (% in use)" -Type Line -DataPointHistory 20 -RefreshInterval 5 -ChartBackgroundColor '#8028E842' -ChartBorderColor '#FF28E842'  -Endpoint {
                try {
                    Get-Counter '\memory\% committed bytes in use' -ComputerName sql -ErrorAction SilentlyContinue | Select-Object -ExpandProperty CounterSamples | Select-Object -ExpandProperty CookedValue | Out-UDMonitorData
                }
                catch {
                    0 | Out-UDMonitorData
                }
            }
        }
    }
    New-UdRow {
        New-UdColumn -Size 6 -Content {
            New-UdMonitor -Title "Network (IO Read Bytes/sec)" -Type Line -DataPointHistory 20 -RefreshInterval 5 -ChartBackgroundColor '#80E8611D' -ChartBorderColor '#FFE8611D'  -Endpoint {
                try {
                    Get-Counter '\Process(_Total)\IO Read Bytes/sec' -ErrorAction SilentlyContinue | Select-Object -ExpandProperty CounterSamples | Select-Object -ExpandProperty CookedValue | Out-UDMonitorData
                }
                catch {
                    0 | Out-UDMonitorData
                }
            }
        }
        New-UdColumn -Size 6 -Content {
            New-UdMonitor -Title "SQL Network (IO Read Bytes/sec)" -Type Line -DataPointHistory 20 -RefreshInterval 5 -ChartBackgroundColor '#80E8611D' -ChartBorderColor '#FFE8611D'  -Endpoint {
                try {
                    Get-Counter '\Process(_Total)\IO Read Bytes/sec' -ComputerName sql -ErrorAction SilentlyContinue | Select-Object -ExpandProperty CounterSamples | Select-Object -ExpandProperty CookedValue | Out-UDMonitorData
                }
                catch {
                    0 | Out-UDMonitorData
                }
            }
        }
        New-UdColumn -Size 6 -Content {
            New-UdMonitor -Title "Disk (% disk time)" -Type Line -DataPointHistory 20 -RefreshInterval 5 -ChartBackgroundColor '#80E8611D' -ChartBorderColor '#FFE8611D'  -Endpoint {
                try {
                    Get-Counter '\physicaldisk(_total)\% disk time' -ErrorAction SilentlyContinue | Select-Object -ExpandProperty CounterSamples | Select-Object -ExpandProperty CookedValue | Out-UDMonitorData
                }
                catch {
                    0 | Out-UDMonitorData
                }
            }
        }
        New-UdColumn -Size 6 -Content {
            New-UdMonitor -Title "SQL Disk (% disk time)" -Type Line -DataPointHistory 20 -RefreshInterval 5 -ChartBackgroundColor '#80E8611D' -ChartBorderColor '#FFE8611D'  -Endpoint {
                try {
                    Get-Counter '\physicaldisk(_total)\% disk time' -ComputerName sql -ErrorAction SilentlyContinue | Select-Object -ExpandProperty CounterSamples | Select-Object -ExpandProperty CookedValue | Out-UDMonitorData
                }
                catch {
                    0 | Out-UDMonitorData
                }
            }
        }
    }
    New-UdRow {
        New-UdColumn -Size 12 {
            New-UdGrid -Title "Processes" -Headers @("Name", "ID", "Working Set", "CPU") -Properties @("Name", "Id", "WorkingSet", "CPU") -AutoRefresh -RefreshInterval 60 -Endpoint {
                Get-Process | Select-Object Name, ID, WorkingSet, CPU | Out-UDGridData
             }
          }
       }
    }
 }
```

}

$Page1 = New-UDPage -Name "Services" -Icon server -Content {

```
New-UDElement -Id "Services" -Tag div4 -EndPoint {

    New-UDGrid -Id "Grid" -Title "Services" -Headers @("Name", "Status", "Select") -Properties @("Name", "Status", "Select") -Endpoint {

        $Cache:Services | Out-UDGridData

    }

}

New-UDButton -BackgroundColor "#26a69a" -Text "Refresh" -OnClick {
    Sync-UDElement -Id "Grid" -Broadcast
}
```

}

Start-UDDashboard -Endpoint @($Services) -Content {
New-UDDashboard -Pages @($HomePage, $Page1) -Title "Service Manager" -Color '#FF050F7F'
} -Port 1000 -Name ServiceM -AutoReload
looks like invoke-udevent does not retain the session like scheduled-endpoint does or something, so basically if you use it once and refresh the grid you can see the status updated but can no longer initiate another onclick to stop a service for example i start on first onclick and i have to stop / start dashbard to get start/stop buttons to be functional again.
if i dont use invoke-udevent and rely only on the schedule endpoint time frame i setup everything works fine as expected.
Hmm, i have no idea why this is happening… :-/
Could you post a bug report on github regarding this?
If you move the “foreach-object” part of the scheduled endpoint to the endpiont of the grid, does it work as intended?
the code currently works fine because am relying on scheduled timing so the endpoint gets called every 20 seconds for example and provides a new cache which is also updated status of the services.
i wanted to test invoke-udevent and have it to reduce the 20 seconds schedule and have it for example 1 day and when you initiate onclick to start/stop service it will also initiate invoke-udevent and recall the endpoint.
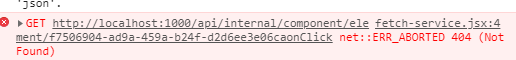
the first onclick is fine but the issue is with the second onclick the error message in dev tools.
i think to solve the issue you need to use same mechanism New-UDEndpointSchedule is using to call the endpoint.
I believe you’re right.
Could you file a bug report on github?
And once it’s replicated, i can look into how endpoint execution differs from the classic powershell “invoke” of a scriptblock.
i already did file a bug report on github yesterday.